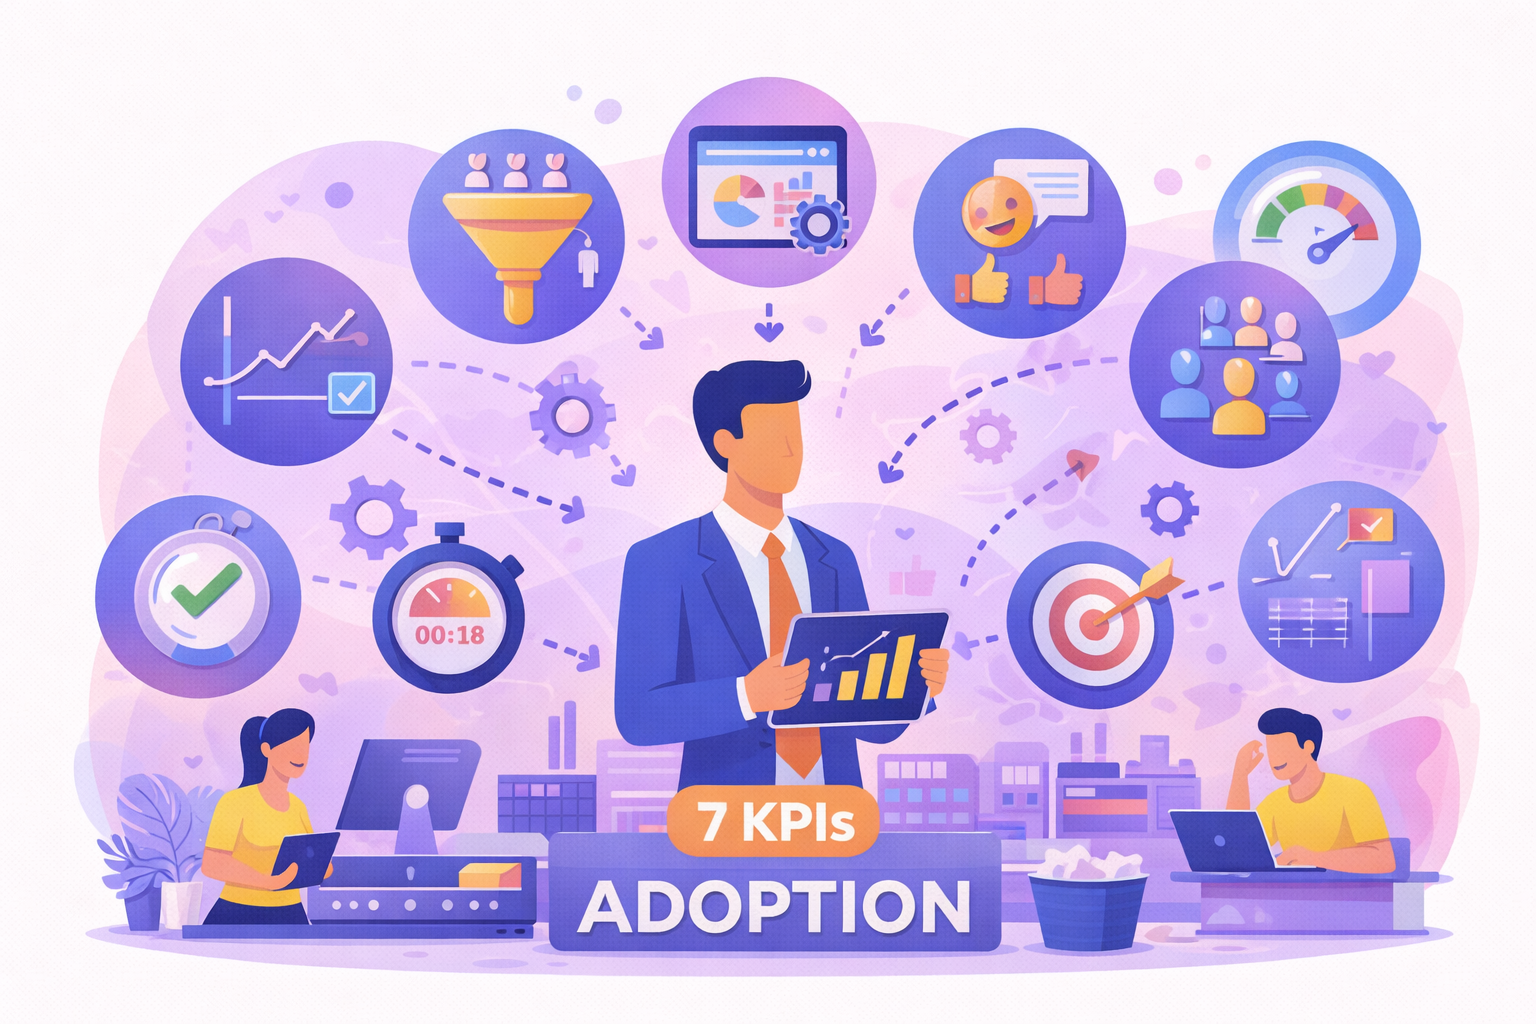
Why track software adoption metrics?
When a new application is rolled out, several questions quickly arise — and software adoption metrics are the key to answering them:
- Are employees actually using the tool?
- Are the key features being used?
- Was the training effective?
- Is the user experience satisfactory?
Without reliable data, these questions are difficult to answer.
Measuring adoption allows you, in particular, to:
- identify barriers to use
- optimise training initiatives
- reduce support requests
- improve the user experience
- maximise the ROI of digital investments
Adoption analytics solutions provide a clear, objective view of these indicators.
1- Active user rate
The first indicator to track is the active user rate.
It measures the proportion of users who actually use the software over a given period (daily, weekly or monthly).
Formula: Active users / Registered users
This indicator answers a simple question: is the software actually being used?
A low activity rate may indicate:
- a lack of training
- poor communication
- an interface that is difficult to use
- resistance to change
It is often the first warning sign of an adoption problem.
2- Frequency of use
Beyond the number of active users, it is important to analyse how often the software is used.
Some users log in regularly, while others only use the tool occasionally.
Analysing this frequency helps you understand:
- whether the tool is embedded in day-to-day practices
- which profiles use the application the most
- which job roles are experiencing difficulties
For example, a CRM platform should ideally be used every day by sales teams.
3- Key feature usage rate
Software often comes with a wide range of features. Yet some are more strategic than others.
Measuring the adoption of these features is essential.
Take the example of an ERP or an HRIS:
- creating orders
- approving workflows
- managing customer data
- tracking indicators
If users do not use these features, the company does not truly benefit from the expected gains.
This analysis helps identify needs for user guidance or additional training.
A digital adoption platform can, for example, offer interactive guides directly within the application to support users.
4- Task completion time
Another important KPI is the time needed to complete a task in the software.
This indicator measures:
- how well users have mastered the tool
- how simple the processes are
- how effective the interface is
If a task takes longer than expected, this may reveal:
- a lack of training
- complex navigation
- unnecessary steps in the process
Tracking this indicator helps identify friction points in the digital experience.
5- Process completion rate
In many business tools, users have to follow specific processes:
- approving requests
- creating files
- managing tickets
- processing orders
The completion rate measures how many of these processes are actually completed in the application.
A low rate may reveal:
- a poor understanding of the steps
- an overly complex process
- a lack of support
To improve this indicator, some companies use immersive training simulators, which allow employees to practise in a simulated environment before using the live application.
6- Number of support requests
The number of tickets or requests sent to support is an excellent indirect indicator of software adoption.
An increase in requests may indicate:
- difficulties in using the software
- poorly understood features
- insufficient training
Conversely, a gradual decrease in requests shows that users are becoming more autonomous
Companies can reduce these requests by introducing:
- contextual guides
- built-in tutorials
- interactive learning paths
7- User satisfaction score
Finally, it is essential to measure how users perceive the software.
Software can be used without being liked. And a poor user experience can hold back adoption in the long term.
The satisfaction score can be measured through:
- internal surveys
- an NPS score
- in-app feedback
This qualitative data helps you understand:
- what works well
- what needs to be improved
- what users expect
How to use these software adoption KPIs to improve adoption
Measuring indicators is a first step. The goal is then to act on the results.
The highest-performing organisations take a continuous approach:
- analyse usage data
- identify friction points
- implement corrective actions
- measure the impact of those actions
Adoption analytics platforms make it possible to centralise this data and steer digital transformation objectively.
With a solution such as K-VALUE, teams can, for example:
- analyse adoption by job role or region
- measure the impact of training initiatives
- track changes in engagement over time
- identify applications that need additional support
Software adoption: a key driver of digital performance
The success of a digital project does not depend solely on the technology chosen.
Above all, it depends on user buy-in.
By tracking relevant KPIs such as usage rate, engagement and process completion, companies can:
- improve the employee experience
- speed up getting to grips with tools
- optimise productivity
- maximise the ROI of their digital investments
At a time when organisations are using more and more applications, measuring and managing adoption is becoming essential.
👉 To find out more, discover how Knowmore solutions can help you support, train and measure the adoption of your business tools through a comprehensive approach combining user guidance, immersive training and adoption analytics.